Video 3 of 4
Long Term Forecasts


Video #3: Long term analysis

Daily & Weekly Analysis
Inspired by Hurst, and developed over 38 years!
This video
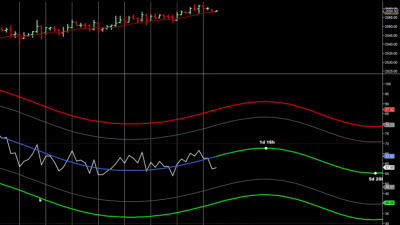
In this short video, John Rawlins, creator of the Quant cycles indicator takes you on a guided tour of the daily and weekly charts available online:
- John shows all the sectors (or groups) of instruments available
- Each instrument has a daily and a weekly chart.
- These charts provide an overview or longer term forecast for what to expect.
Learn more
Make sure that you register for a Quant Cycles webinar to learn more about this exciting new development in the world of Hurst Cycles and to claim your special Hurst cycles discounts.